What does your ideal online dashboard look like?
Published Dec 2, 2022, 7:00 AM
Written by Amanda Brown and Designs by Kandice Stern
We build custom dashboards to fit your staff, your decision-makers and even your customers, using all the information you have available to you (plus some you might not have realised you can get).
Imagine logging in to your computer and using a dashboard where all the information you need is in one place. One login could get you into all the systems you use, with important information updated live and summarised where you need it.
Some people call a dashboard an intranet, extranet, nerve centre, nerd centre or a single pane of glass. Others call it ‘a relief’, ‘remarkable’ or ‘a huge time-saver’.
A secure dashboard brings all the data sources you need together in one place so you can make better decisions.
We build custom dashboards to fit your staff, your decision-makers and even your customers, using all the information you have available to you (plus some you might not have realised you can get).
We’ve written about three different kinds of dashboard users so you can see the ways they bring information together in a personal, intuitive way. If you’re thinking, ‘Hmm, it would be better if it did X, Y or Z,’ then we’d be keen to talk to you about making your dashboard fit your needs.
- A council’s dashboard giving ratepayers a range of essential information
- Manager’s dashboard
- Board dashboard keeping their eye on strategy and key indicators rather than drowning in details
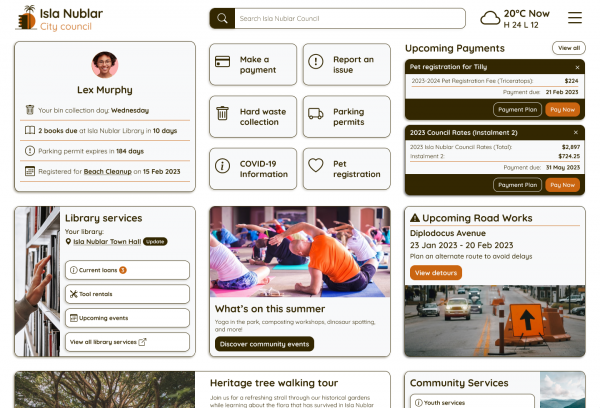
Giving locals the information they need: how a council uses a dashboard to give website visitors the info they’re after
Major focus: relevant information for end users and fast access to important accounts, payments and submissions
Their dashboard: a landing page that directs site visitors to the priority information they need, and a customer dashboard that gets smarter as more user data is gathered to continuously improve their experience
Dashboard for anonymous users
- relevant news and alerts based on browsing behaviour (if they allow cookies)
- most-visited content from previous visits can be displayed first on the page
- location data can deliver information relevant to where the visitor is browsing from
Dashboard for logged-in users
- ability to manage their account information, pay for bills, register for events and contribute their feedback on council consultations
- customised site setup to show the information they most want to view
- specific updates that are most relevant to their locations or interests
Benefits:
- customisation of the site to show information each site visitor thinks is most important to them
- access to follow up on queries or submissions online
- offers of new information that might also interest the site visitor, based on their location or previous searches
- alerts and notifications based on the user’s current geographic location or other location data they’ve entered, eg their residence or business location
Experience the full-screen Figma prototype here. (Opens in new tab)
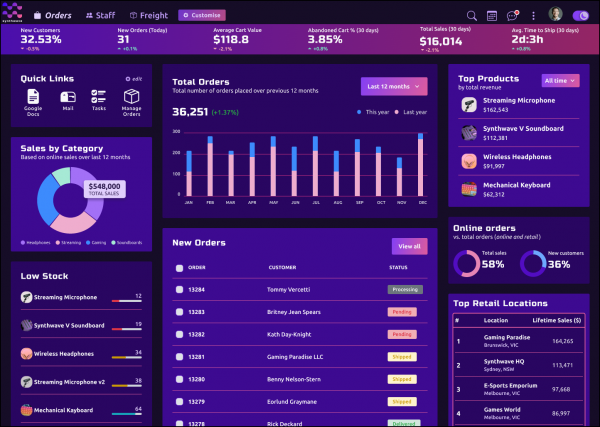
Keeping an eagle eye on business indicators: how a manager of a manufacturing company uses a dashboard
Major focus: oversight of key business indicators and problems so they can respond quickly
Their dashboard: a single, customisable screen that integrates and displays information from these sources:
- staffing
- orders: current vs predicted
- freight delays
- rate of throughput
- team performance
- maintenance issues raised/resolved
- customer service queries raised/resolved
- progress of major projects.
Benefits:
- fewer meetings
- no emails to sift through to get updates
- display of trends with ability to drill down into detailed information
- oversight over the operations to enable quick responses to problems.
Experience the full-screen Figma prototype here. (Opens in new tab)
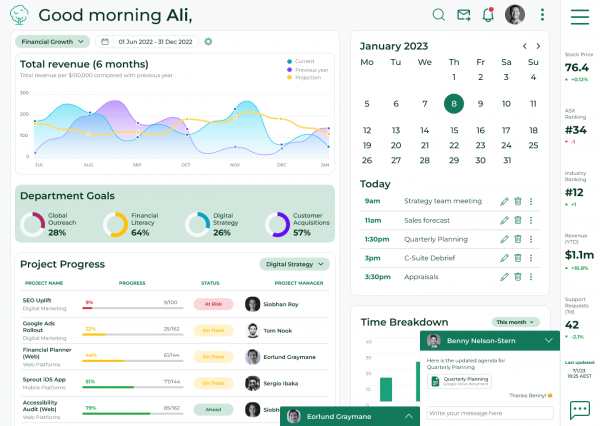
Up-levelling board performance: how company directors and a CEO use a strategic dashboard
Their major focus: strategy-level updates, key indicators of the health of the organisation, early notice of issues/trends, streamlined board meetings and focused actions.
Their dashboard:
- board governance: secure storage of apps to manage the constitution, minutes of past meetings, board calendar, strategic planning documents, agenda for upcoming meeting and briefing papers
- online messaging feature to talk to CEO and other board members
- key indicators from across the organisation, as defined by the strategic plan, board and/or CEO). These which might include current Vs predicted sales, accidents/incidents rate, cash flow and balance sheets, etc
- media releases and stories
- progress of major projects.
Benefits:
- secure and confidential location for all board information
- easy onboarding of new board members
- constant oversight by the board via up-to-the-minute information about the organisation’s key indicators
- each user can customise the dashboard to prioritise their areas of interest or specialisation
- efficient board meeting preparation, with meeting notices, attendance and task reminders
- fast online prompts for minutes and decisions to be captured on the spot, and to assign tasks to people within the system
- quick and secure conversations via the online message system, rather than by emails or texts
- significant time saving for CEO and staff who prepare reports and summaries for board meetings and answer questions between meetings.
Experience the full-screen Figma prototype here. (Opens in new tab)
